Architecture Analysis And Visualization Tool (AAV Tool)
- Project
- 20023 SmartDelta
- Type
- New product
- Description
The architecture analysis and visualization tool is designed to derive multiple architectural views from a variety of input files including .ceps and log files.
- Contact
- Abhishek Shrestha, Fraunhofer FOKUS
- abhishek.shrestha@fokus.fraunhofer.de
- Technical features
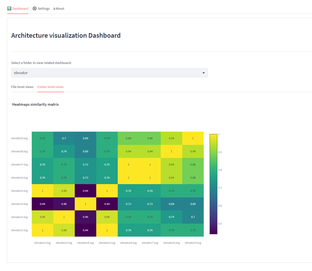
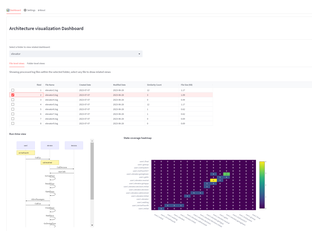
Run-Time View: This view is illustrated through a sequence diagram and shows the interactions among different components as recorded in a log file. State Coverage Heatmap: This heatmap quantifies and visualizes the frequency of visits to each state during a particular run, providing information like the usage and behavior of states in the system. Heatmap Similarity Matrix: This view offers a comparative analysis, displaying the pairwise similarity between state coverage heatmaps, which is valuable for understanding if similar faults have occurred before. Events Map Diagram. This view illustrates the relationship among state machines based on the shared events. Users can drag and drop multiple ceps files into the input widget in the UI. These input files are then processed to derive both outgoing and incoming events associated with the state machines defined by each ceps file. The resulting diagram displays state machines as nodes and uses event connections as edges.
- Integration constraints
The Python based tool is tested in both Ubuntu (18 and 22) and Windows 10. It requires the following: Python = 3.9 Streamlit = 1.26 MySQL = 8.0 CREATE_schema_tables.sql - (needed to create required schema) mysql-connector-python = 8.0 Plotly = 5.14 Pandas = 2.0
- Targeted customer(s)
The tool is targeted especially for the AKKA usecase where the generated architectural views would be helpful for developers and first level QC in fault diagnosis. These diagrams provide insights for initial quality control, effectively localizing faults and supporting the diagnostic process.
- Conditions for reuse
Open source
- Confidentiality
- Public
- Publication date
- 27-11-2023
- Involved partners
- Fraunhofer (DEU)
- AKKA Industry Consulting GmbH (DEU)


